
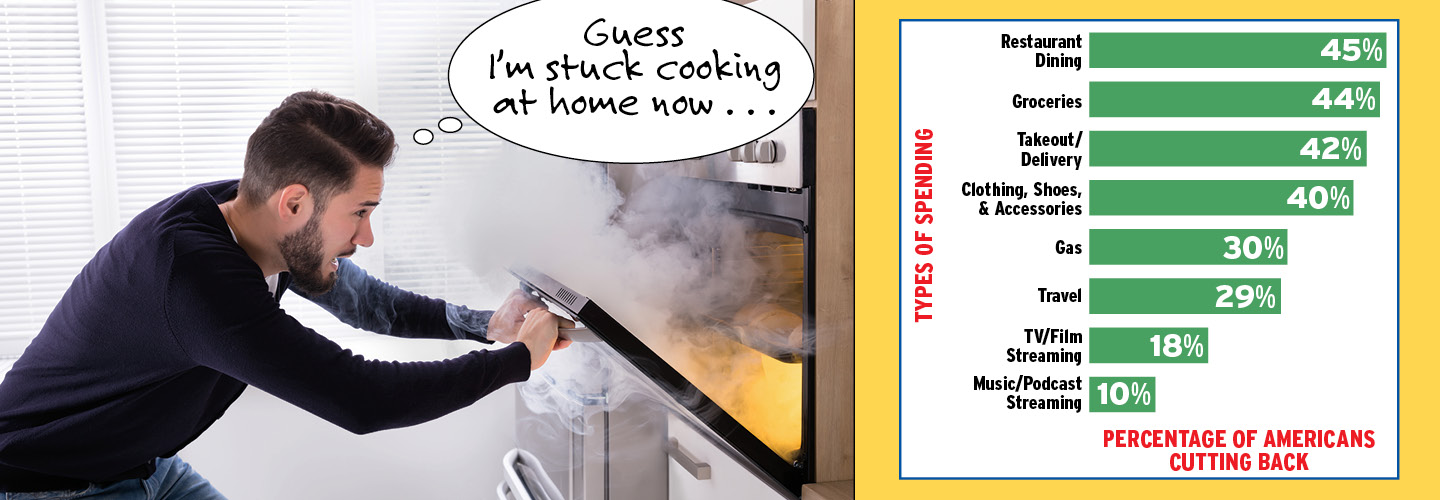
As inflation causes the price of almost everything to rise, many Americans have begun reducing their spending. This chart shows the percentage of U.S. consumers who tried to cut back on various items over the past six months. Why do you think the top three are food-related?
Back to Teacher View
Student View
Shutterstock.com (oven)
How Americans Are Cutting Back
TYPES OF SPENDING / PERCENTAGE OF AMERICANS CUTTING BACK
RESTAURANT DINING 45%
GROCERIES 44%
TAKEOUT/DELIVERY 42%
CLOTHING, SHOES, & ACCESSORIES 40%
GAS 30%
TRAVEL 29%
TV/FILM STREAMING 18%
MUSIC/PODCAST STREAMING 10%
SOURCE: National Research Group. Data is from August 2022.
Text-to-Speech