Haven't signed into your Scholastic account before?
Teachers, not yet a subscriber?
Subscribers receive access to the website and print magazine.
You are being redirecting to Scholastic's authentication page...
Announcements & Tutorials
Explore Primary Sources
How Students and Families Can Log In
1 min.
Setting Up Student View
Sharing Articles with Your Students
2 min.
Interactive Activities
4 min.
Sharing Videos with Students
Using Upfront with Educational Apps
5 min.
Join Our Facebook Group!
Exploring the Archives
Powerful Differentiation Tools
3 min.
World and U.S. Almanac & Atlas
Subscriber Only Resources
Access this article and hundreds more like it with a subscription to The New York TImes Upfront magazine.
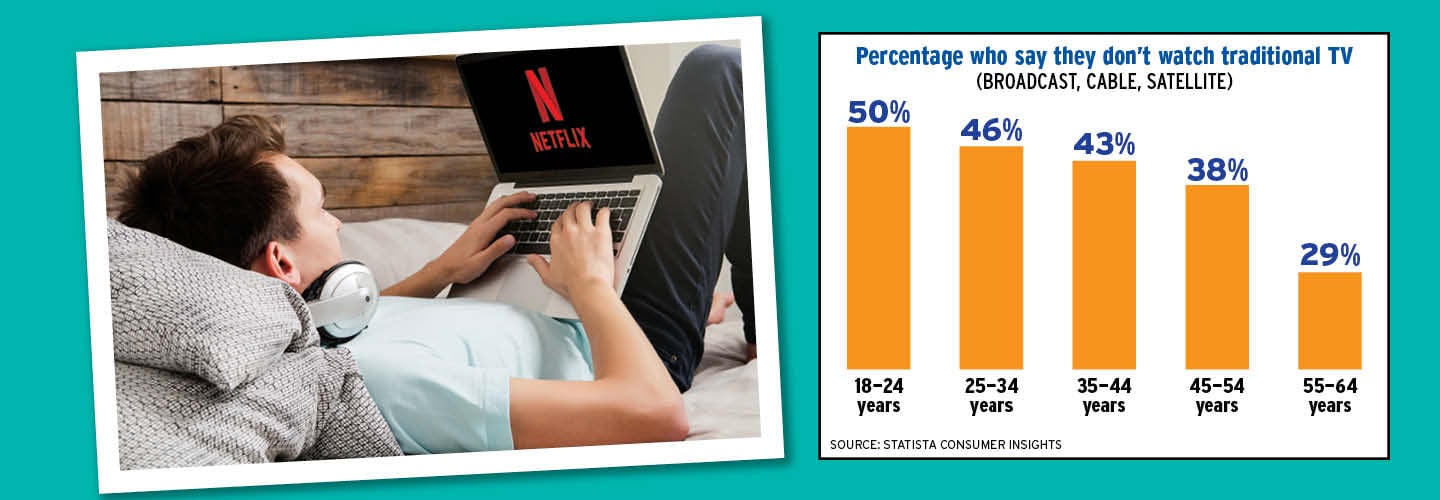
Percentage who say they don’t watch traditional TV (Broadcast, cable, satellite): 18–24 years: 50%; 25–34 years: 46%; 35–44 years: 43%; 45–54 years: 38%; 55–64 years: 29%. Source: Statista Consumer Insights | Photo: Shutterstock.com
Article Options
Presentation View
Turning Off Traditional TV
Young people are growing increasingly less interested in traditional TV, thanks to streaming services such as Netflix and Disney+. Americans ages 18 to 34 watch less than five hours of broadcast, cable, or satellite programs per week, while those age 65 and older watch more than 40 hours on average. This graph shows the percentage of people in each age group who say they watch no traditional TV at all. Why do you think there’s such a big difference between generations?