
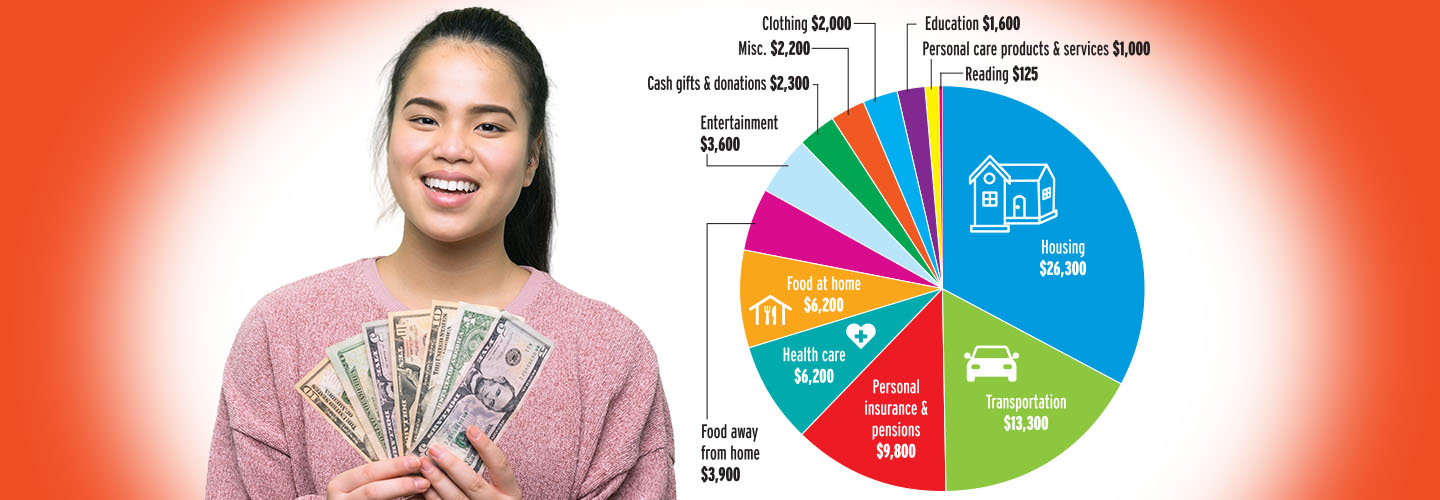
This pie chart shows Americans’ average annual expenditures by category, according to a 2024 survey by the U.S. Bureau of Labor Statistics. Almost half of consumer spending goes toward housing and transportation, while the smallest amounts go toward things like reading and personal care. Do any of the results surprise you?
Back to Teacher View
Student View
Shutterstock.com
How Americans Spend Their Money
How Americans Spend Their Money
Housing $26,300; Transportation $13,300; Personal insurance & pensions $9,800; Health care $6,200; Food at home $6,200; Food away from home $3,900; Entertainment $3,600; Cash gifts & donations $2,300; Misc. $2,200; Clothing $2,000; Education $1,600; Personal care products & services $1,000; Reading $125
Text-to-Speech